
Social Media Usage in 2026 – The Global Social Media Report
Social Media Usage in 2026 – The Global Social Media Report. Everything you need to know about Social Media Data Trends in 2026
Internet Statistics
Social Media
AI Adoption
2026 Report
Global Internet Usage Report 2026: 6 Billion Users, 1 Billion AI Adopters, and a World Still Connecting
The internet has now reached more than six billion people. Social media users are a global supermajority. And artificial intelligence has crossed a milestone that few predicted would arrive so soon. This is the state of the world online in 2026.
Updated May 2026 · Sources: DataReportal / Kepios, GSMA Intelligence, GWI, Similarweb, Statista, ITU, UN World Population Prospects
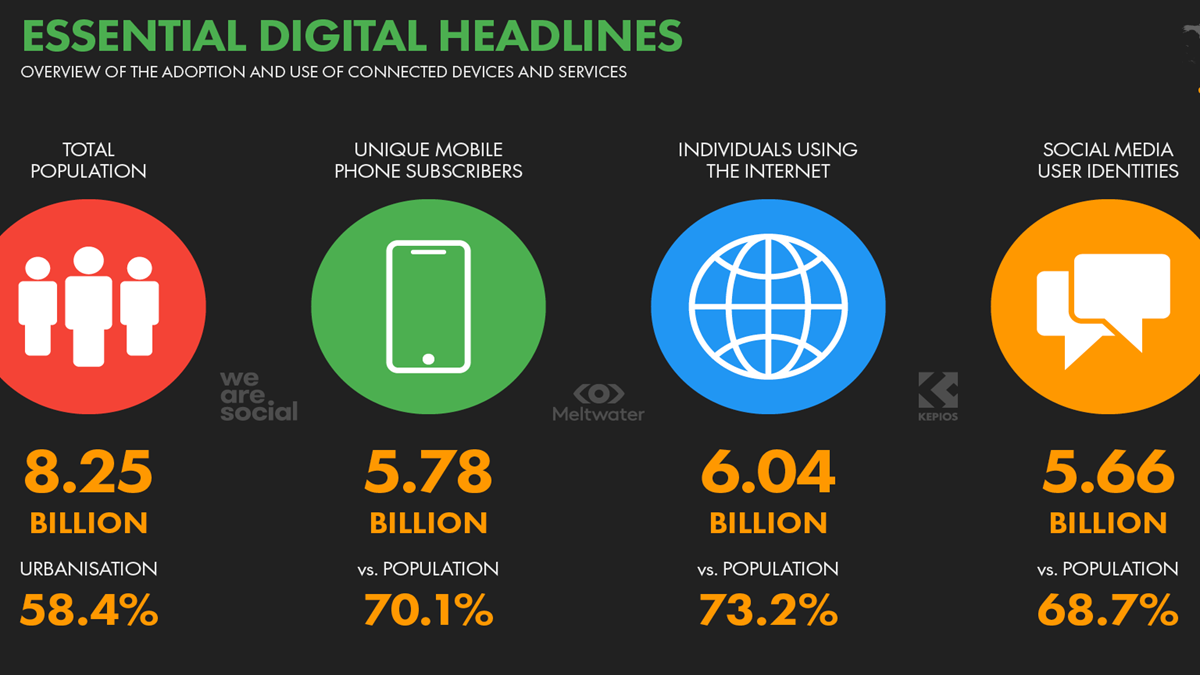
| 6.12B Internet users worldwide 73.8% of global population (Apr 2026) |
5.66B Social media user identities 68.7% of world population |
1B+ Monthly AI platform users GenAI adoption doubled in 12 months |
| 5.78B Unique mobile users 70.1% of the global population |
6h 38m Average time online per day Per connected adult worldwide |
$1.16T Global ad spend in 2025 74.4% flowing to digital channels |
Key figures: Kepios / DataReportal Digital 2026 Global Overview Report (Oct 2025) and updated data to April 2026.
1. Six Billion People Are Now Online
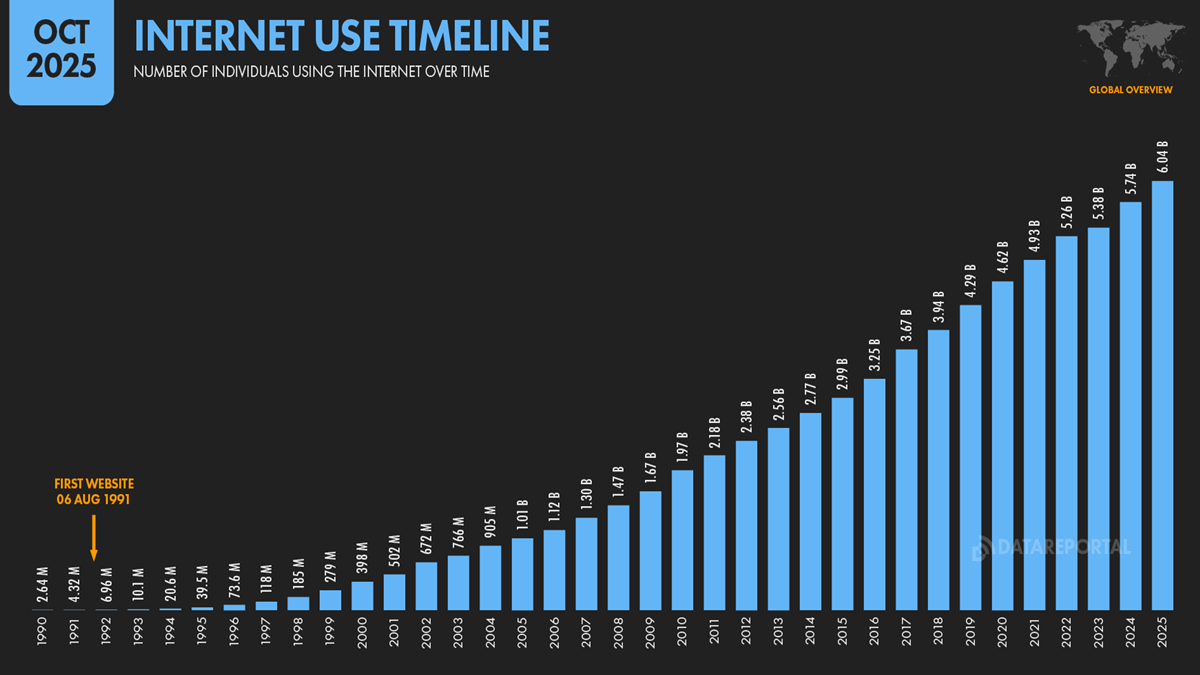
For the first time in history, more than six billion people are connected to the internet. According to Kepios analysis in the DataReportal Digital 2026 Global Overview Report, the global internet user total reached 6.04 billion by October 2025 — a penetration rate of 73.2 percent. By April 2026, that figure had climbed to 6.12 billion, equivalent to 73.8 percent of the world’s population.
To put this in historical context: when the first website went live in August 1991, there were just five million internet users on Earth. It took until 2014 to reach three billion. Doubling to six billion has taken just eleven years — a pace that reflects the explosive growth of affordable smartphones, cheaper mobile data, and the spread of digital infrastructure into developing economies.
“The global internet user figure has doubled in just under 11 years, having reached the 3-billion user mark in early November 2014.” — DataReportal Digital 2026 Global Overview Report
Annual growth has been substantial. Over the twelve months to October 2025, reported internet user figures increased by 294 million (+5.1 percent) — though significant upward revisions to figures for India and China account for a large portion of that headline gain.
India and China: Revised Upwards
India’s National Statistics Office reported that 70 percent of Indians aged 15 and above are now online — more than ten percentage points higher than the previous estimate. Applied to India’s total population, this puts the number of internet users in India at over one billion, with 86.3 percent of Indian households having some form of internet connection.
Meanwhile, China’s internet reporting body CNNIC indicated that 91.6 percent of individuals in China now use the internet or internet-powered services — lifting the Chinese internet user total to almost 1.3 billion, or roughly 21.5 percent of the entire global connected population.
Internet Penetration by Region (2025–2026)
Sources: Kepios / DataReportal, Statista, ITU. Figures reflect latest available data to early 2026.
2.17 Billion People Remain Offline
Despite these impressive gains, approximately 2.17 billion people had no internet access as of April 2026. The majority of the world’s offline population lives in Southern Asia and across Africa. India, despite its revised figures, still has the largest unconnected population in absolute terms — more than 440 million people remain offline. North Korea continues to hold the world’s lowest internet adoption rate, with fewer than one in every hundred citizens able to access the internet.
The cost of access remains a significant barrier in many regions. In the Central African Republic, the cheapest non-promotional cellular data plan costs the equivalent of more than a quarter of the typical monthly income — contributing to an internet adoption rate of just 12 percent.
The Gender and Location Gaps
Gender inequality in internet access persists globally. Kepios analysis shows that 70.7 percent of women are now online, compared with 75.7 percent of men — meaning men are roughly 7 percent more likely to be internet users than women. There are still nearly 240 million more men online than women worldwide. This imbalance carries through to social media, where 54.4 percent of users are male and 45.6 percent female.
The urban-rural divide is even sharper. Just 54.5 percent of rural populations worldwide are online, compared with 86.5 percent of urban populations. Urban areas house 58.4 percent of the global population but account for nearly 70 percent of the world’s connected users.

2. Social Media Users Are Now a Global Supermajority
Social media use has reached an extraordinary milestone. Kepios analysis puts global social media user identities at 5.66 billion — 68.7 percent of the total global population. There are now twice as many people using social media each month as there are not using it. In less than 30 years since social media first emerged, it has gone from a niche curiosity to the default mode of human communication online.
Kepios records show that global social media user identities stood at just under 2.27 billion in October 2015. In the decade since, 3.4 billion new users have joined — an average of more than 28 million new users every month, or close to one million per day.
Top Platforms by Monthly Active Users (% of online adults aged 16+)
Source: GWI Q2 2025 — % of online adults aged 16+ who used each platform in the past 30 days (global).
Time Spent Per App (Android, August 2025)
| Platform | Avg. time/day | Avg. daily sessions | Avg. session length |
|---|---|---|---|
| TikTok | 1h 37m | 10 | 9m 42s |
| YouTube | 1h 25m | 5.9 | 14m 29s |
| 1h 13m | 12 | 5m 56s | |
| 1h 07m | — | 7m 17s | |
| 0h 59m | 20+ | ~3m |
Source: Similarweb App Intelligence, Android users, August 2025.
For broader context: the average online adult now spends roughly 33.5 hours per week consuming all types of online media, including streaming TV. Social and video feeds account for more than half of that — meaning the typical internet user spends around 16 percent of their waking hours scrolling feeds.
3. More Than One Billion People Now Use AI Every Month
Artificial intelligence has crossed a threshold that would have seemed extraordinary just three years ago. Kepios analysis concluded that more than one billion people now use large language models and generative AI platforms each month. Updated data from April 2026 indicates that global GenAI adoption more than doubled over the preceding twelve months, with 1.4 billion new users embracing these platforms during that period.
ChatGPT Dominates Outside China
Similarweb data indicates that more than 550 million people use ChatGPT’s mobile app each month, while close to 500 million unique device identities visit the web platform monthly. OpenAI’s CEO Sam Altman reported 800 million weekly users in early October 2025 — which suggests a likely monthly active user figure of around one billion for ChatGPT alone. Yet ChatGPT accounts for only around four in five active AI users outside China.
China is separately home to an estimated 250 million AI agent users, sufficient to push the global total well above one billion. Google has noted that its AI search summaries now reach more than two billion active users monthly — illustrating the breadth of AI’s reach when embedded within existing platforms people already use every day.
4. Mobile: The Dominant Access Point
The smartphone has become the primary portal to the internet for the majority of the world’s connected population. GSMA Intelligence data indicates there are 5.78 billion unique mobile users worldwide — 70.1 percent of the global population — with that figure growing by 108 million over the past twelve months. Smartphones now account for 86.9 percent of all mobile handsets in use.
Share of Global Web Traffic by Device
Source: StatCounter / BroadbandSearch, latest monthly snapshot 2025–2026.
5G infrastructure continues to expand rapidly. As of 2025, 5G coverage is available to approximately 55 percent of the world’s population, with global 5G subscriptions reaching approximately three billion. By 2030, projections suggest that around 73 percent of smartphone users will access the internet solely via their phones.
5. Digital Advertising: $1.16 Trillion and Counting
The global advertising market reached approximately $1.16 trillion in 2025, according to Statista Market Insights — up 6.5 percent year on year. Digital channels now account for 74.4 percent of that total, up from 72.7 percent in 2024. As recently as 2018, traditional channels still commanded more than half of all ad spend; the pandemic-driven shift to digital has proved permanent.
| Channel | 2025 Spend | YoY Growth | Share of Digital |
|---|---|---|---|
| Online search | $352 billion | +11.1% | ~39% |
| Social media | $277 billion | +13.6% | 32.1% |
| Online retail media | $204 billion | +22.0% | 23.7% |
| Traditional TV | $146 billion | — | N/A |
Source: Statista Market Insights, 2025 projections.
The United States commands the world’s highest ad spend per capita at $1,327 per inhabitant annually. The UK ranks second at $930, while Australia and Switzerland are roughly tied at $769. Pakistan sits at the other extreme at just $2.88 per person. In terms of ad spend as a percentage of GDP, the UK leads at 1.65 percent, followed by the US at 1.49 percent and Japan at 1.34 percent.
6. The State of Online Search in 2026
Search advertising may be growing, but the underlying audience behaviour is shifting. GWI’s latest survey data shows that just 80.3 percent of online adults used a search engine in the past month — the lowest figure recorded. Over the past twelve months, that share has declined by a relative 2.5 percent. Statcounter data confirms that Google still accounts for close to 90 percent of all search engine referrals to third-party websites, but its overall share has edged downward to one of the lowest levels seen in the past decade.
Google’s AI Overviews now reach more than two billion users monthly. Whether this cannibalises traditional search ad inventory or expands the total market is a question that will define digital marketing strategy for years to come. For now, with $352 billion in annual search ad spend, even a 1–2 percent shift in traffic represents billions of dollars.
7. Television in the Streaming Era
The line between internet and television has effectively dissolved. GWI data shows that 91.7 percent of online adults consume some form of streaming TV content each month, and 94.6 percent watched online video in the past 30 days. Streaming now accounts for 50.4 percent of internet users’ total TV watch time — despite a greater share of adults still watching traditional broadcast TV each week (73.5 percent) than streaming platforms (69.9 percent).
In the United States, streaming accounts for 59.4 percent of total TV viewing time. Nielsen data for August 2025 shows YouTube now claims the single greatest share of US TV viewing at 13.1 percent — up from 10.6 percent a year earlier — ahead of Disney at 9.7 percent and Netflix at 8.7 percent. YouTube’s CTV ad formats reach 84.6 percent of its total audience in the US. 56 percent of marketers globally plan to increase CTV spending in 2025.
8. The Digital Divide: Who Is Still Being Left Behind
Six billion connected people is a landmark achievement. It is also a reminder that 2.17 billion people — more than one in four people on Earth — remain offline. Understanding who remains offline, and why, is essential context for anyone working in digital policy, development, or marketing.
Geographic Concentration of the Offline Population
The majority of the world’s unconnected population lives in Southern Asia and across Central and Eastern Africa. Eastern Africa has an internet penetration rate of just 28.5 percent. Western Africa has approximately 268 million offline residents — a population larger than most countries. Middle Africa’s penetration rate hovers around 25 percent.
Young People Are the Most Connected
Globally, approximately 82 percent of people aged 15 to 24 use the internet, compared with around 72 percent of the broader population. In the United States, nearly all adults aged 18 to 29 are online, while internet adoption among those 65 and older has grown to around 75 percent.
Infrastructure, Affordability, and Literacy
Three barriers consistently emerge: infrastructure gaps (no physical connection available), affordability (connection exists but is too expensive), and digital literacy (connection is accessible but individuals lack the skills to use it). These factors reinforce one another. In Ethiopia, fewer than half the population has access to electricity and basic drinking water services — and internet adoption is correspondingly low in rural areas.
9. What Marketers Should Actually Do in 2026
Data at this scale can generate paralysis as easily as insight. Here are four evidence-based priorities grounded in the statistics above — not in speculative trends.
1. Do not abandon search — but watch it closely
Search advertising is still the single largest category of digital ad spend and the primary channel through which people discover new brands. A decline of 1–2 percent in Google traffic represents real money, but it does not yet justify radical budget reallocation. Monitor carefully; act when the data supports it, not when a headline suggests it.
2. Social media remains non-negotiable — but platform mix matters
A presence on two or three of the top platforms offers the ability to reach nine in ten social media users. Platform preferences vary sharply by age: Instagram and TikTok dominate under-35s, while Facebook and WhatsApp become more important for audiences over 35. Platform selection should follow audience composition, not trend cycles.
3. AI as a channel is here — and it rewards existing good practices
With over one billion monthly AI platform users and Google’s AI summaries reaching two billion, generative AI is already a meaningful channel. AI optimisation looks remarkably similar to good SEO: authoritative content, clear meaning, strong third-party mentions, and active PR. There is no AI marketing playbook that requires abandoning what already works.
4. CTV is genuinely worth testing in 2026
YouTube’s ascent to the top of US TV viewing share, combined with its 84.6 percent CTV ad reach in that market, makes connected TV a concrete and measurable opportunity. For brands historically focused on linear TV, or under-investing in video, 2026 is a reasonable moment to pilot CTV campaigns.
10. Key Numbers at a Glance: 2026 Internet Summary
| Metric | Latest figure | Source / date |
|---|---|---|
| Global internet users | 6.12 billion (73.8%) | Manochi / DataReportal, Apr 2026 |
| Year-on-year growth | +59 million (+1.0%) | Manochi / DataReportal, Apr 2026 |
| People still offline | 2.17 billion | Manochi / DataReportal, Apr 2026 |
| Unique mobile users | 5.78 billion (70.1%) | GSMA Intelligence, Oct 2025 |
| Social media user identities | 5.66 billion (68.7%) | Kepios / DataReportal, Oct 2025 |
| AI platform users (monthly) | 1 billion+ (doubled in 12 months) | Kepios / Manochi, 2025–2026 |
| Avg. daily time online | 6 hours 38 minutes | GWI / Statista, 2025–2026 |
| Mobile share of web traffic | ~52% (51.6–64% by source) | StatCounter / BroadbandSearch, 2026 |
| Global ad spend (2025) | $1.16 trillion | Statista Market Insights |
| Digital share of ad spend | 74.4% | Statista Market Insights, 2025 |
| Search ad spend | $352 billion (+11.1% YoY) | Statista, 2025 |
| Social media ad spend | $277 billion (+13.6% YoY) | Statista, 2025 |
| US internet penetration | 93.1% (324 million users) | DataReportal / Statista, 2025–2026 |
| Streaming share of US TV | 59.4% of viewing time | Nielsen, 2025 |
| 5G population coverage | ~55% of world population | GSMA Intelligence, 2025 |
Sources and methodology: This report draws principally on the DataReportal / Kepios Digital 2026 Global Overview Report (published October 2025), updated with mid-year data from Manochi’s analysis published via DataReportal in April 2026. Additional data points are sourced from GWI, GSMA Intelligence, Statista Market Insights, Similarweb App Intelligence, Nielsen, StatCounter, ITU, and the UN World Population Prospects. All figures are cited to their original sources; where estimates vary across sources, ranges have been noted. Data correct to the best of our knowledge at time of publication.